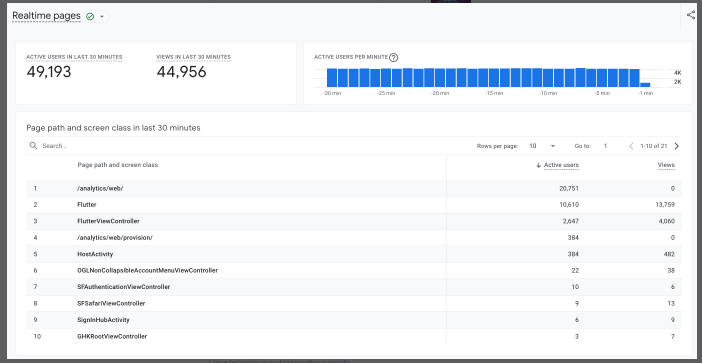
Google has introduced a new Realtime Pages report for Google Analytics 4 (GA4), providing improved insights into your website’s live performance.
Key Features
The newly launched Realtime Pages report in Google Analytics 4 (GA4) offers a snapshot of your website’s live activity. You can find it under the Reports menu in GA4.

It includes two key summary cards:
- Key Metrics Card: The total number of views and active users over the past 30 minutes.
- Bar Graph Card: Displays the number of active users per minute for the last 30 minutes in real time.
Below these cards, there’s a detailed table that breaks down active users by page path and screen class, offering:
- Screen classes and page pathways arranged according to views and active users
Total views in the last 30 minutes for every page or screen - The number of unique active users per page or screen within the same timeframe
Accessing the New Report
To access the Realtime Pages report, follow these steps:
- Sign in to Google Analytics.
- Select “Reports” from the left-hand menu.
- Click on “Realtime Pages” in the left sidebar.
Practical Applications
This report offers a range of benefits, such as:
- Instantly identifying which pages are gaining the most attention.
- Evaluating the immediate impact of marketing campaigns on site traffic.
- Quickly spotting and addressing potential issues affecting user experience or performance.
Limitations
While the Realtime Pages report provides valuable live data, there are a few limitations to keep in mind:
- The report is not customizable.
- It does not currently support filters or comparisons.
These restrictions may limit some advanced analysis, but the report remains useful for real-time monitoring and quick decision-making. However, it’s important to note that this feature is not meant to replace dedicated debugging tools in the platform.


