Want a fun and straightforward method to highlight a type of data, a study, a trend …? Infographics have invaded the web, especially for blog content and social networks. Because of their visual impact and their increased readability, they are all the more most acclaimed. Individual or business, you too want to create infographics, but without necessarily having to hire a graphic designer? DesignCap infographic maker is your solution: a quick overview of the creation of infographics in general, then of the application.

How to succeed in your infographic?
Digital photo graphics consist of highlighting data, analyzes, or results in a readable and impactful way. The target is to generate virality on the internet so that you can increase traffic to your website, or even strengthen your brand identity.
To get a successful infographic, you need to play well its content and style. It must be visual, comprehensive, and meaningful to your target.
1. The content of your infographic
Your infographic will only be acclaimed if the data presented to bring real knowledge to your readers or probably new insight or something treated according to an original or differentiated point of view: your point of view. Besides, infographics generally present the results of a new study, a system of teaching method, the evolution of a trend, a step of graphic design, a social phenomenon, etc. And, of course, they cite their sources sometimes to reassure the Internet user and guarantee the integrity of the information.
The content will tell readers what you are going to convey. Collect all the information you want to show in the infographic and put them on the design.
To summarize: it is because we have information that is of real interest to our targets that we then decide to make infographics if it is suitable. And if not vice versa!
2. The style of your infographic

Once you get your content information ready, get them customized in your design using DesignCap. The custom visual content will tell readers what you are going to convey in an aesthetic way.
As a type of data (figures, text) translated visually, graphics must take precedence over the rest, including shapes, icons, photos, charts, text, modules, etc. DesignCap allows you to choose a template from the thousands of preset ones. Then customize the template with your collected information. Here are some tips for making your infographics.
- An infographic should be airy and straightforward. If possible, the main elements should be read and integrated by the user in less than five seconds.
- The different typographies and colors must be harmonious, present in a limited number (two types of font and four colors are ideal).
- Respect the proportion of seven to one: we consider that an infographic must not exceed 5000 pixels long, for 735 pixels wide.
- If you have data in files of XLS, XLSX, CSV, import it directly into your design. If you don’t have any data, other elements will catch your eyes, such as icons, photos, shapes, or other visual elements created for the occasion.
How to make infographics?
Like other popular freemium applications, such as Infogr.am, Visual.ly, Easy.ly, DesignCap also has free and paid plans. And it offers unequaled creation options, for a result very close to what you could obtain via a professional graphic designer, but at a lower cost. What are the steps?

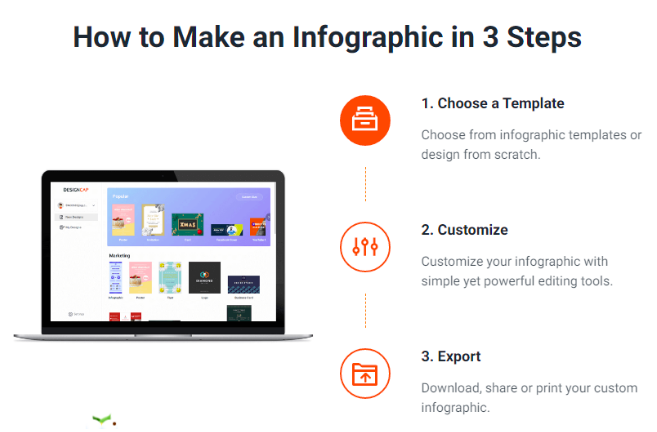
1. Choose a template
DesignCap infographic maker works hard upstream to save you much time. You will thus have access to constantly updated templates for infographics, social media arts, reports, presentations, etc. Picking a style that matches your needs should not be a problem.
2. Make it unique
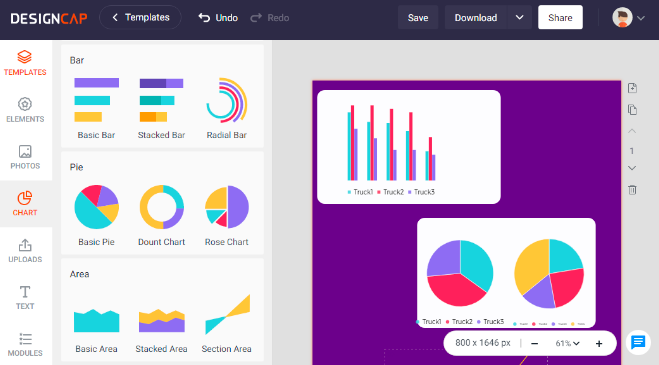
You have the option to edit your texts, fonts, and colors freely on DesignCap. Modify your infographic to your liking by adding shapes, diagrams, tables, pie charts, timelines, and others. There are more than a million icons and stock photos in DesignCap. Find one that perfectly illustrates your topic and customize its color, size, position, etc. It also enables you to upload your images to the cloud and use it anytime when you log in to your DesignCap account.
3. Share your creation
When it comes to impressing your audiences with the printable material, DesignCap makes it easy. Just click the Print button to print your design directly from the app.
For the share option, DesignCap allows you to get a fast sharing to social media. Besides, you can grab the URL link to share it on your website. Do you prefer to send it to your friends or partners by e-mail? DesignCap has the option too.
In terms of its Download section, select from different formats (JPG, PNG, PDF) according to different resolutions and distribute them freely.
What else can DesignCap do?

As I mentioned above in this post, DesignCap is much more than just an infographic maker. You can also do the following:
1. Marketing and event materials
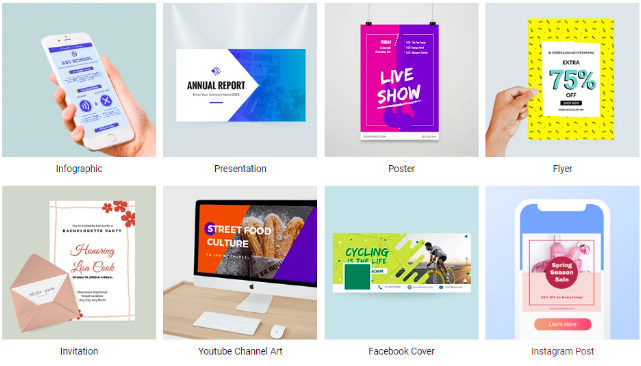
DesignCap offers some beautiful templates for marketing and event for different topics such as Facebook Ad, flyer, invitation card, presentation, poster, report, etc. And each with its collection of templates in different styles. If you advertise online, you can use DesignCap to create attractive and captivating banner ads in various sizes.
2. Social media graphics
If you have a Facebook page, YouTube channel, and other accounts on other social media platforms, make a banner or graphics to appeal to more fans. DesignCap also offers you options to create photo graphics for Facebook cover, YouTube channel art, Tumblr banner, Twitter header, Instagram post, etc.
Conclusion:
As you use the DesignCap app to design your infographic, ask yourself the right questions: is your goal to highlight a trend, compare information, etc. How will your data be best highlighted (using diagrams, tables, icons, photos, other custom designs)? What is the essential information? Which will you decide to include to favor the readability of your infographic?
The different choices and options offered by the DesignCap application will guide you intuitively in your decisions!


